MARKET INSIGHTS: MARKET OUTLOOK 2025
Considering how dire the headlines and stock price moves appeared to be in April with the Tariff headlines I know it’s tempting to move to the sidelines and delay making investments or even sell and wait and see how things develop with a view to ‘re-entering the market’ when valuations might be more attractive and the outlook clear. The problem is the evidence suggests that approach rarely works out! With new record highs being made in the US stock market last week I thought it’s worth reflecting on this.
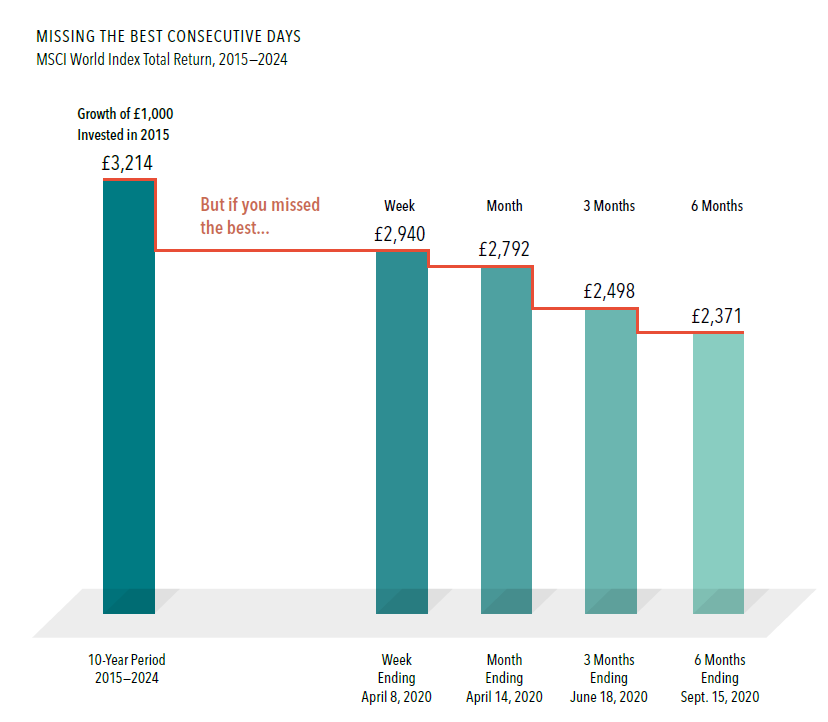
The impact of being out of the market for a short time can be profound, as shown by this hypothetical investment in the MSCI World Index, a broad Global stock market benchmark.
Investment Example
-
A hypothetical £1,000 investment made in 2015 turns into £3,214 for the 10-year period ending December 31, 2024.
-
Miss the MSCI World’s best week, and the value shrinks to £2,940. Miss the best three months, and the total return falls to £2,498.
-
There’s no proven way to time the market—targeting the best days or moving to the sidelines to avoid the worst. Staying invested and focused on the long term helps to ensure that you’re in position to capture what the market has to offer.
In GBP. For illustrative purposes.
Best performance dates represent end of period (April 08, 2020, for best week; April 14, 2020, for best month; June 18, 2020, for best three months; and September 15, 2020, for best six months). The missed best consecutive days examples assume that the hypothetical portfolio fully divested its holdings at the end of the day before the missed best consecutive days, held cash for the missed best consecutive days, and reinvested the entire portfolio in the MSCI World Index (net div., GBP) at the end of the missed best consecutive days. Data presented in the growth of £1,000 exhibit is hypothetical and assumes reinvestment of income and no transaction costs or taxes. The data is for illustrative purposes only and is not indicative of any investment. MSCI data © MSCI 2025, all rights reserved.
Indices are not available for direct investment; therefore, their performance does not reflect the expenses associated with the management of an actual portfolio.
Risks : Buying Investments can involve risk. The value of your Investments and the income from them can go down as well as up and is not guaranteed at anytime. You may not get back the full amount you invested. Information on past performance is not a reliable indicator for future performance. This information is intended for educational purposes and should not be considered a recommendation to buy or sell a particular security. The views expressed here are subject to change without notice and we can’t accept any liability for any loss arising directly or indirectly from any use of it.
To discuss your financial requirements or obtain other information click below
Share this article with your friends by clicking below