
US Market Not Partying Like It’s 1999
Much has been made of current US stock market valuations. As of November 30, the aggregate price-to-book ratio of the US market was 5.21—more than double the valuations of non-US developed and emerging market stocks. Many observers have drawn parallels to the late 1990s, when the gap between US and non-US valuations was similarly wide. Some view this as an omen for future returns—and not a good one given the US market’s infamous “lost decade” starting in 2000.
But this comparison may not be apples to apples. The weighted average profitability of the US market has surged in recent years, rising from 42% five years ago to 62% as of November 30. That’s a very different backdrop from 1999, when US market profitability declined over the subsequent five years.
Valuation ratios can be high because expected returns are low or because expected future earnings growth is high. There is no evidence that investors can reliably disentangle these effects in real time. But the strong profitability growth of recent years suggests a more nuanced story behind today’s US valuations. It is not clear that the US market requires poor future returns in order to “grow into” its current valuation levels.
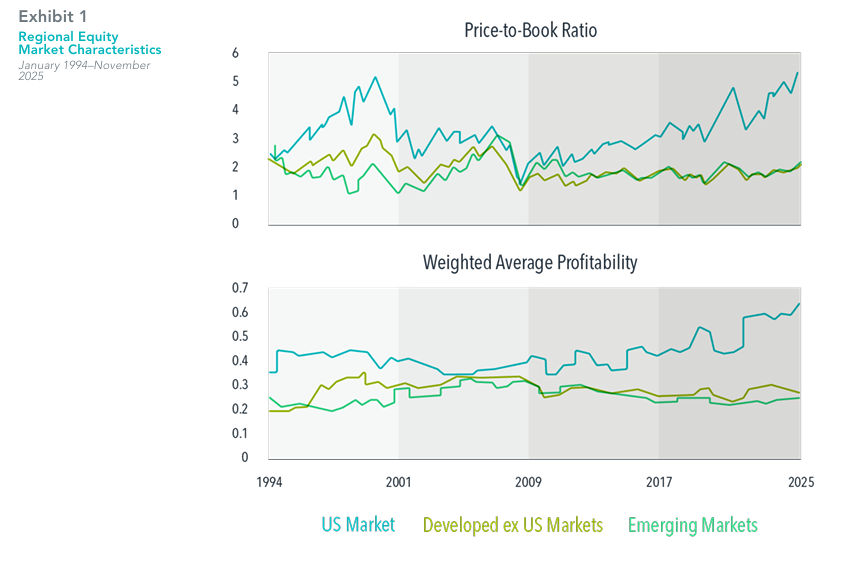
In USD. Source: CRSP and Compustat data calculated by Dimensional. Fama/French data provided by Fama/French. US Market is represented by the Fama/French Total US Market Research Index. Developed ex US Market is represented by the Fama/French International Market Research Index. Emerging Markets is represented by the Fama/French Emerging Markets Index. Monthly aggregate price-to-book ratios are computed as the inverse of the weighted average book-to-market value as of month-end. Firms with negative book value are excluded. Book-to-market ratios above 10 are winsorized as the cutoff value in non-US markets. Profitability is measured as operating income before depreciation and amortization minus interest expense scaled by book. Profitability values above 5 and below −2 are winsorized as the cutoff value. The Fama/French indices represent academic concepts that may be used in portfolio construction and are not available for direct investment or for use as a benchmark. Eugene Fama and Ken French are members of the Board of Directors of the general partner of, and provide consulting services to, Dimensional Fund Advisors LP.
Aggregate price-to-book ratio: The ratio of a firm’s market value to its book value, where market value is computed as price multiplied by shares outstanding, and book value is the value of stockholder equity as reported on a company’s balance sheet.
Profitability: A company’s operating income before depreciation and amortization minus interest expense scaled by book equity.
Risks : Buying Investments can involve risk. The value of your Investments and the income from them can go down as well as up and is not guaranteed at anytime. You may not get back the full amount you invested. Information on past performance is not a reliable indicator for future performance. This information is intended for educational purposes and should not be considered a recommendation to buy or sell a particular security. The views expressed here are subject to change without notice and we can’t accept any liability for any loss arising directly or indirectly from any use of it.
To discuss your financial requirements or obtain other information click below
Share this article with your friends by clicking below
Chasing the returns of the biggest stocks in the US?
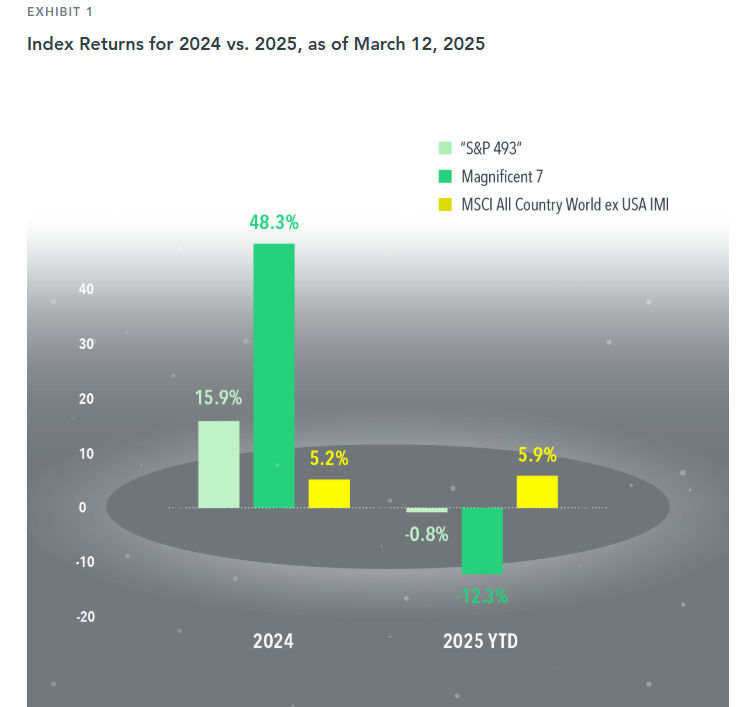
If top stocks exert a gravitational pull on the broad market’s return, the Magnificent 7 (Apple, Nvidia, Amazon, Tesla, Meta, Microsoft, Alphabet)have acted like the TON 618 black hole over the US the past few years.1 Accounting for about one-third of the S&P 500 Index’s weight2, the performance of these stocks has been a big driver of market-capitalization-weighted US large cap stock index returns.
This force can pull in a positive or negative direction. In 2024, the S&P 500 returned 25.0%. This was driven heavily by the Magnificent 7, which returned 48.3%. The other 493 stocks in the index collectively returned 15.9%. This year, the opposite effect has played out: The Magnificent 7 returned –12.3% through March 12, compared to –0.8% for the “S&P 493.”
The swings in performance for a US large cap index make a compelling case for global all cap diversification, which helps lessen exposure to the Magnificent 7. While non-US stocks underperformed the US in 2024, the MSCI All Country World ex USA IMI Index is outpacing the US thus far in 2025. Diversifying across regions and market capitalization is one way to mitigate the impact of a handful of stocks.
Risks : Buying Investments can involve risk. The value of your Investments and the income from them can go down as well as up and is not guaranteed at anytime. You may not get back the full amount you invested. Information on past performance is not a reliable indicator for future performance. This information is intended for educational purposes and should not be considered a recommendation to buy or sell a particular security. The views expressed here are subject to change without notice and we can’t accept any liability for any loss arising directly or indirectly from any use of it.
To discuss your financial requirements or obtain other information click below
Share this article with your friends by clicking below
MARKET INSIGHTS: MARKET OUTLOOK 2025
Probably unlike most, I enjoy reading Market Outlook Reports from the previous year and compare them with what actually happened! I normally do this in between Christmas and New year when reports are issued for the coming year. These reports look appealing and well put together and include lots of research and graphs.
However making forecasts about the next twelve months turns out not to be a good guide to anything... hence we don’t send them out (ask me if you want to see them anyway).
This chart from Bloomberg shows in pink the range of professional (!) forecasters – UBS, Morgan Stanley, Citi, Wells Fargo, Barclays, etc – for where the US market will finish the year. And the black diamonds show where the market ended up. You can see these forecasts have been overly pessimistic in 4 of the last 5 years.
So given this insight we recommend looking beyond the headlines, focusing on what you can control and sticking with a diversified range of investments to meet your planning goals which is where we can help.
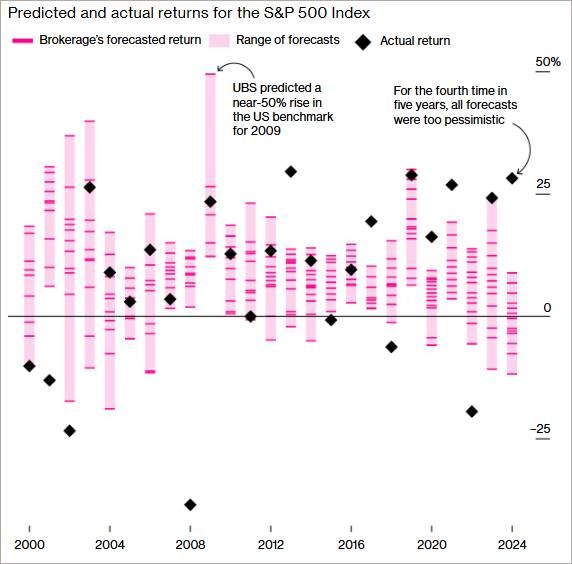
Source: Bloomberg LLP.
Risks : Buying Investments can involve risk. The value of your Investments and the income from them can go down as well as up and is not guaranteed at anytime. You may not get back the full amount you invested. Information on past performance is not a reliable indicator for future performance. This information is intended for educational purposes and should not be considered a recommendation to buy or sell a particular security. The views expressed here are subject to change without notice and we can’t accept any liability for any loss arising directly or indirectly from any use of it.
To discuss your financial requirements or obtain other information click below
Share this article with your friends by clicking below
COLERIDGE CAPITAL MODEL PORTFOLIO SERVICE
We are delighted to announce that we have formed an Investment Committee and Model Portfolio Service with M&G for the benefit of our clients.
Given the dynamic nature of the market at this time we want to make sure our clients benefit from making revisions to their portfolios on a regular basis. Our Model Portfolio Service will allow for automatic changes to fund managers and investment allocation to manage the level of risk and returns agreed with you. Our existing clients can opt for this service without incurring costs for the revision.
Economic factors as well as fund managers should be closely monitored. We believe that leveraging the resources, scale and research teams of M&G, who manage £370 Billion, will further improve our services.
Of course we continue to retain our status as an Independent Financial Adviser so can make and tailor any solutions to suit your individual requirements, preferences and objectives.