

Magnificent Expectations
Market prices reflect what investors expect to happen in the future. When a group of stocks delivers returns far above the broad stock market, it’s likely these companies surprised investors in a good way.
This principle is challenging to uncover in the data because the market’s expectations are hard to quantify, even with the benefit of hindsight. Sure, we can compare a company’s reported earnings against what was forecast by analysts. But there’s dispersion in analysts’ forecasts. And sometimes earnings reports are accompanied by messaging from the company about its future business that impacts prices. So, a company can beat its earnings forecast and still experience a price decline.
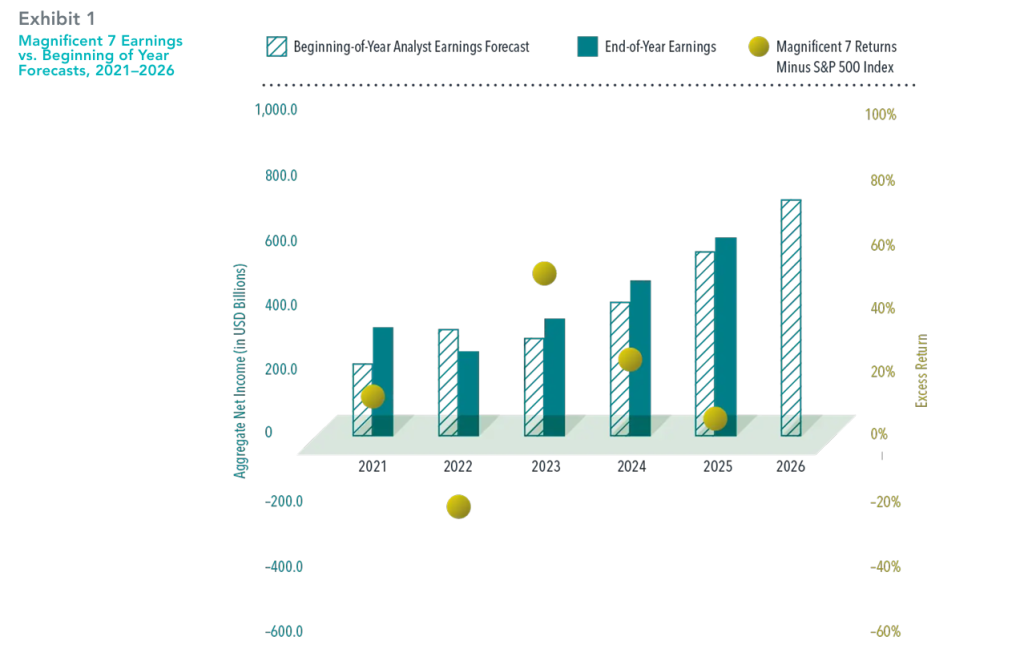
All that said, sometimes we see strong indicators of earnings surprises. Recent years for the Magnificent 7 stocks are a good example. From 2021 through 2025, aggregate earnings for these companies exceeded average beginning-of-year expectations in all but one year, 2022. Their stocks outpaced the broad market in all but one year. I bet you can guess which year they underperformed.
Obviously, we don’t yet have 2026 results. But forecasted earnings for the Mag 7 are even higher this year. That means a potentially higher bar these companies must clear such that they can deliver outsized returns
If you'd like to discuss how these themes relate to your own financial planning objectives, and to assess whether your portfolio is appropriately diversified rather than overly concentrated in the Magnificent Seven, please feel free to get in touch.
Risks : Buying Investments can involve risk. The value of your Investments and the income from them can go down as well as up and is not guaranteed at anytime. You may not get back the full amount you invested. Information on past performance is not a reliable indicator for future performance.
In USD. Source: Dimensional and FactSet, calculated by Dimensional. The Magnificent 7 stocks are represented by Tesla, Meta, Alphabet, Amazon, Nvidia, Apple, and Microsoft. Magnificent 7 Returns are a weighted average of the seven companies. Beginning of Year Earnings Forecast is the sum of average next 12-month net income analyst estimates for each Magnificent 7 stock as of December 31 of the prior year. End of Year Earnings is the sum of actual reported trailing 12-month net income for each Magnificent 7 stock as of December 31 for the stated year. Indices are not available for direct investment; therefore, their performance does not reflect the expenses associated with the management of an actual portfolio.
S&P data © 2026 S&P Dow Jones Indices LLC, a division of S&P Global.
Risks : Buying Investments can involve risk. The value of your Investments and the income from them can go down as well as up and is not guaranteed at anytime. You may not get back the full amount you invested. Information on past performance is not a reliable indicator for future performance. This information is intended for educational purposes and should not be considered a recommendation to buy or sell a particular security. The views expressed here are subject to change without notice and we can’t accept any liability for any loss arising directly or indirectly from any use of it.
To discuss your financial requirements or obtain other information click below

Share this article with your friends by clicking below

Value vs Growth
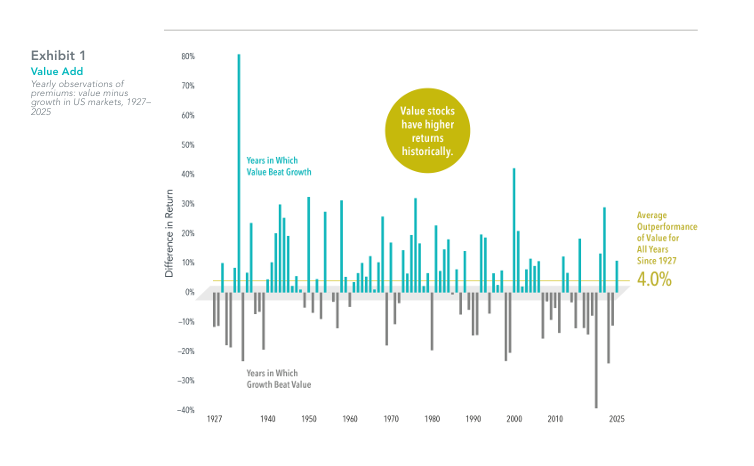
Historically, value stocks have outperformed growth stocks in the US (the largest stock market in the world) often by a striking amount. Data covering nearly a century backs up the notion that value stocks—those with lower relative prices—have higher expected returns.
While disappointing periods emerge from time to time, the principle that lower relative prices lead to higher expected returns remains the same. Value premiums have often shown up quickly and in large magnitudes. For example, in years when value outperformed growth, the average premium was nearly 15%. On average, value stocks have outperformed growth stocks by 4.0% annually in the US since 1927, as Exhibit 1 shows.
A consistent focus on value stocks is essential to capturing these outsize value premiums when they appear. Value investing is based on the premise that paying less for a set of future cash flows is associated with a higher expected return. That’s one of the most fundamental tenets of investing. Logic and history support a commitment to value stocks so investors can be positioned to take part when those shares outperform in the future.
Risks:Buying investments can involve risk. The value of your investments and the income from them can go down as well as up and is not guaranteed at any time. You may not get back the full amount you invested. Information on past performance is not a reliable indicator for future performance.
Fama/French Indices: The Fama/French indices represent academic concepts that may be used in portfolio construction and are not available for direct investment or for use as a benchmark. Index returns are not representative of actual portfolios and do not reflect costs and fees associated with an actual investment.
Currency and Premiums: In US dollars. Yearly premiums are calculated as the difference in one-year returns between the two indices described.
Value Minus Growth: Fama/French US Value Research Index minus the Fama/French US Growth Research Index.
Fama/French US Value Research Index: Provided by Fama/French from CRSP securities data. Includes the lower 30% in price-to-book of NYSE securities (plus NYSE MKT (formerly AMEX) equivalents since July 1962 and Nasdaq equivalents since 1973).
Fama/French US Growth Research Index: Provided by Fama/French from CRSP securities data. Includes the higher 30% in price-to-book of NYSE securities (plus NYSE MKT (formerly AMEX) equivalents since July 1962 and Nasdaq equivalents since 1973).
Backtested Performance: Results shown during periods prior to each index's inception date do not represent actual returns of the respective index. Other periods selected may have different results, including losses. Backtested index performance is hypothetical and is provided for informational purposes only to indicate historical performance had the index been calculated over the relevant time periods. Backtested performance results assume the reinvestment of dividends and capital gains.
GLOSSARY
Value Stock: A stock trading at a low price relative to a measure of fundamental value such as book equity.
Growth Stock: A stock trading at a high price relative to a measure of fundamental value such as book equity.
Value Premium: The return difference between stocks with low relative prices (value) and stocks with high relative prices (growth).
Risks : Buying Investments can involve risk. The value of your Investments and the income from them can go down as well as up and is not guaranteed at anytime. You may not get back the full amount you invested. Information on past performance is not a reliable indicator for future performance. This information is intended for educational purposes and should not be considered a recommendation to buy or sell a particular security. The views expressed here are subject to change without notice and we can’t accept any liability for any loss arising directly or indirectly from any use of it.
To discuss your financial requirements or obtain other information click below
Share this article with your friends by clicking below
Outpacing Inflation with Stocks
Inflation is back in the news of late, as the year-over-year change in the consumer price index is at the highest level since 2023 in the US which is the worlds largest economy. This may stoke fears of further inflation for many investors.
It’s important to note that expected inflation is incorporated into the expected returns demanded by market participants. To the extent inflation is expected to impact either future cash flows from an investment, or the discount rate applied to these cash flows, market prices adjust to compensate, resulting in positive expected real returns. This is borne out in historical data. Average real returns for the broad US stock market, based on the S&P 500 Index, have been positive even in years when US inflation was above the historical median. Average real returns for US small cap and small cap value stocks have been even higher, implying investors should not shy away from tilting toward higher expected return stocks even if inflation expectations are elevated.
We believe one way for investors to deal with inflation is to outpace it. Stocks have been a good way to do this historically, as the evidence from the US illustrates.
To review the diversification of your own investments feel free to get in touch.
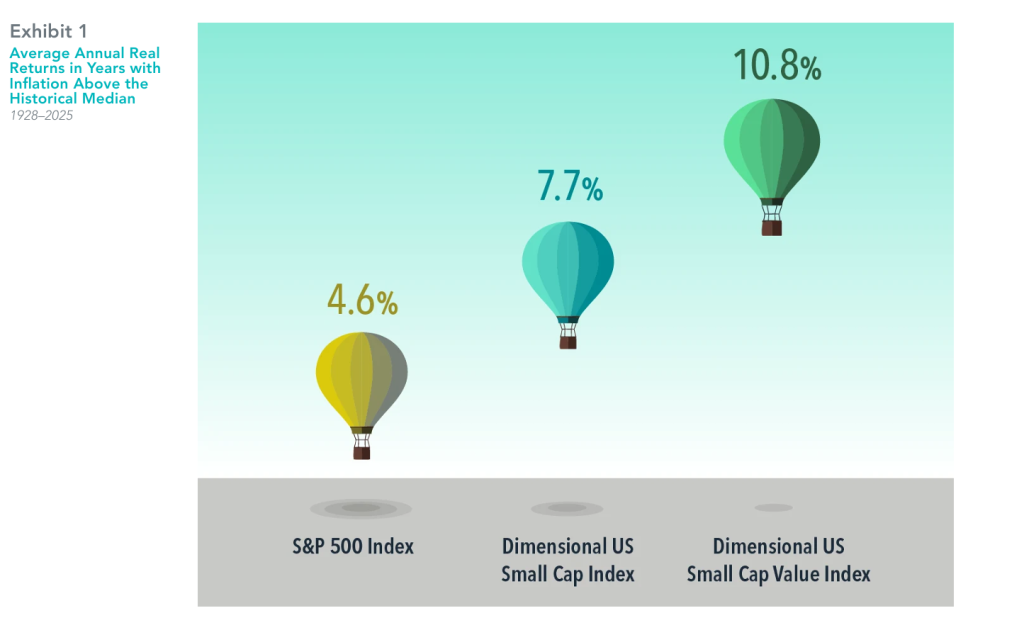
In USD. US inflation is the annual rate of change in the consumer price index for all urban consumers (CPI-U, not seasonally adjusted) from the US Bureau of Labor Statistics. Nominal return is the rate of return on an investment without adjusting for inflation. Real return is the rate of return on an investment after adjusting for inflation. Real returns are calculated using the following method: [(1 + nominal return) / (1 + inflation rate)] – 1. The Dimensional indices represent academic concepts that may be used in portfolio construction and are not available for direct investment or for use as a benchmark. Index returns are not representative of actual portfolios and do not reflect costs and fees associated with an actual investment.
See “Index Descriptions” in the appendix for descriptions of the Dimensional index data.
S&P data © 2026 S&P Dow Jones Indices LLC, a division of S&P Global. Indices are not available for direct investment.
Risks : Buying Investments can involve risk. The value of your Investments and the income from them can go down as well as up and is not guaranteed at anytime. You may not get back the full amount you invested. Information on past performance is not a reliable indicator for future performance. This information is intended for educational purposes and should not be considered a recommendation to buy or sell a particular security. The views expressed here are subject to change without notice and we can’t accept any liability for any loss arising directly or indirectly from any use of it.
To discuss your financial requirements or obtain other information click below
Share this article with your friends by clicking below
Will the Magnificent 7 Stay on Top
The Magnificent 7 entered 2025 among the Top 10 largest US stocks. But before making an outsize bet on gains from these technology giants, investors should consider a few lessons from market history.
- It’s hard to stay on top. For example, only three of the 10 biggest companies from 1980 made the 2000 list—and none of them was in 2025’s Top 10.
- Industries ebb and flow. Technology-focused firms currently dominate the list. But in 1980, six of the 10 largest companies were in the energy sector.
- New technology doesn’t benefit only tech firms. Throughout history, companies across industries have used technology to innovate and grow.
Diversification enables investors to share in the success of today’s top companies while staying positioned to benefit from tomorrow’s market leaders.
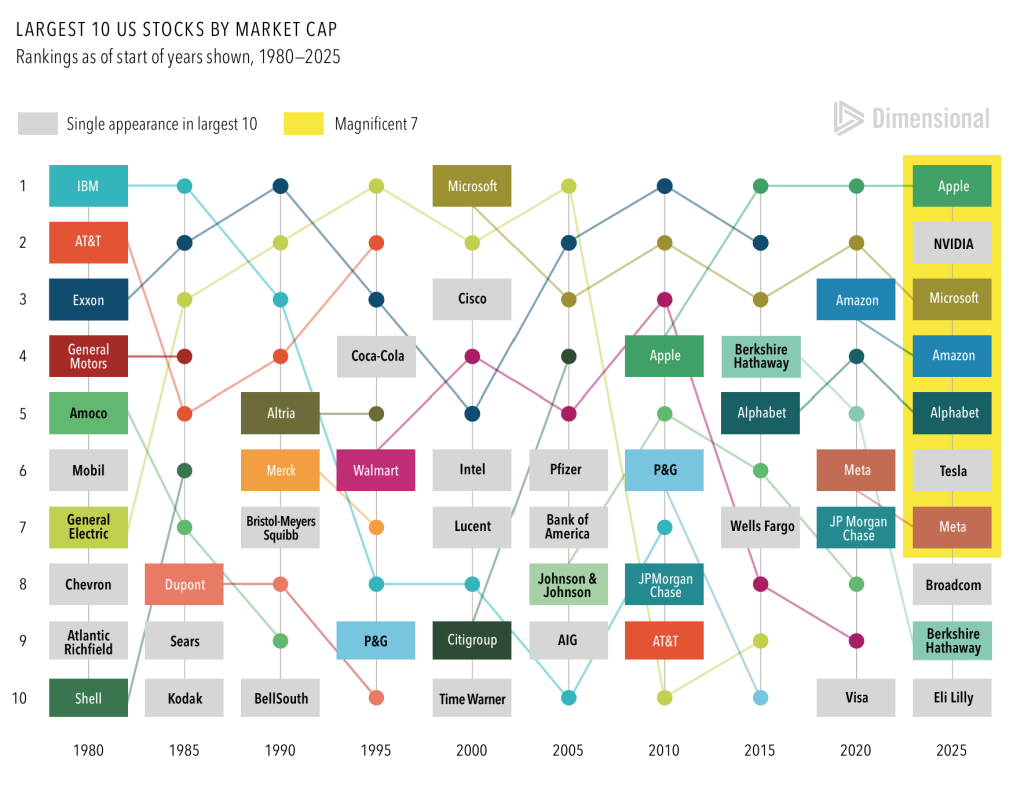
The Magnificent 7 stocks are Alphabet, Amazon, Apple, Meta Platforms, Microsoft, NVIDIA and Tesla.
Source: Dimensional, using data from the Center for Research in Security Prices and Compustat. Includes all US common stocks. Largest stocks identified at the end of the calendar year preceding the respective period by sorting eligible US stocks on market capitalisation using data provided by the CRSP, University of Chicago.
Risks : Buying Investments can involve risk. The value of your Investments and the income from them can go down as well as up and is not guaranteed at anytime. You may not get back the full amount you invested. Information on past performance is not a reliable indicator for future performance. This information is intended for educational purposes and should not be considered a recommendation to buy or sell a particular security. The views expressed here are subject to change without notice and we can’t accept any liability for any loss arising directly or indirectly from any use of it.
To discuss your financial requirements or obtain other information click below
Share this article with your friends by clicking below
US Market Not Partying Like It’s 1999
Much has been made of current US stock market valuations. As of November 30, the aggregate price-to-book ratio of the US market was 5.21—more than double the valuations of non-US developed and emerging market stocks. Many observers have drawn parallels to the late 1990s, when the gap between US and non-US valuations was similarly wide. Some view this as an omen for future returns—and not a good one given the US market’s infamous “lost decade” starting in 2000.
But this comparison may not be apples to apples. The weighted average profitability of the US market has surged in recent years, rising from 42% five years ago to 62% as of November 30. That’s a very different backdrop from 1999, when US market profitability declined over the subsequent five years.
Valuation ratios can be high because expected returns are low or because expected future earnings growth is high. There is no evidence that investors can reliably disentangle these effects in real time. But the strong profitability growth of recent years suggests a more nuanced story behind today’s US valuations. It is not clear that the US market requires poor future returns in order to “grow into” its current valuation levels.
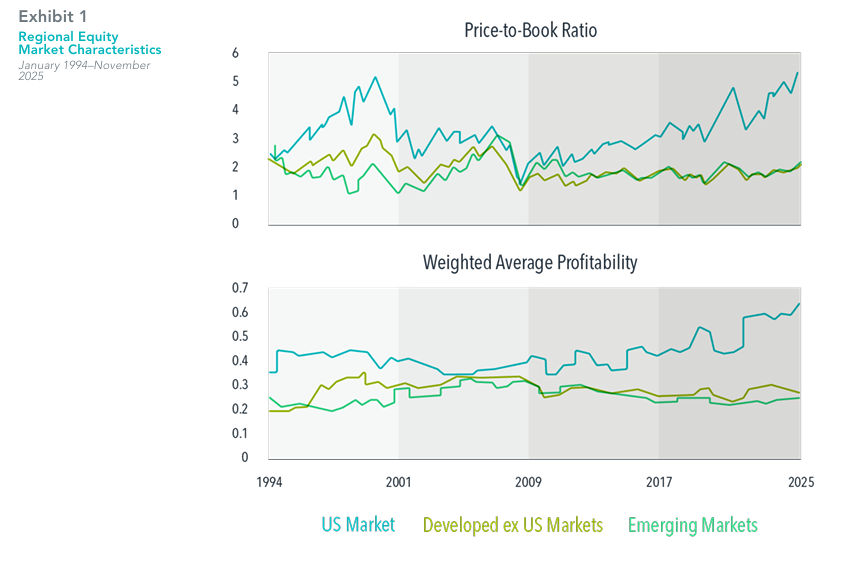
In USD. Source: CRSP and Compustat data calculated by Dimensional. Fama/French data provided by Fama/French. US Market is represented by the Fama/French Total US Market Research Index. Developed ex US Market is represented by the Fama/French International Market Research Index. Emerging Markets is represented by the Fama/French Emerging Markets Index. Monthly aggregate price-to-book ratios are computed as the inverse of the weighted average book-to-market value as of month-end. Firms with negative book value are excluded. Book-to-market ratios above 10 are winsorized as the cutoff value in non-US markets. Profitability is measured as operating income before depreciation and amortization minus interest expense scaled by book. Profitability values above 5 and below −2 are winsorized as the cutoff value. The Fama/French indices represent academic concepts that may be used in portfolio construction and are not available for direct investment or for use as a benchmark. Eugene Fama and Ken French are members of the Board of Directors of the general partner of, and provide consulting services to, Dimensional Fund Advisors LP.
Aggregate price-to-book ratio: The ratio of a firm’s market value to its book value, where market value is computed as price multiplied by shares outstanding, and book value is the value of stockholder equity as reported on a company’s balance sheet.
Profitability: A company’s operating income before depreciation and amortization minus interest expense scaled by book equity.
Risks : Buying Investments can involve risk. The value of your Investments and the income from them can go down as well as up and is not guaranteed at anytime. You may not get back the full amount you invested. Information on past performance is not a reliable indicator for future performance. This information is intended for educational purposes and should not be considered a recommendation to buy or sell a particular security. The views expressed here are subject to change without notice and we can’t accept any liability for any loss arising directly or indirectly from any use of it.
To discuss your financial requirements or obtain other information click below
Share this article with your friends by clicking below
Mind the Gap - Diversifying Across Countries
While many of us enjoy an international holiday this summer it might be timely to talk about countries!
Recently, there’s been a lot of noise around which country one should invest their savings in for the best growth, and the idea of allocating away from the US for many reasons. In the first half of 2025, developed markets outside the US returned 19.0%, outperforming the US and emerging markets. But that outcome masks the wide range of returns across individual countries, from Spain’s 43.0% to Denmark at −5.5%. This kind of dispersion isn’t unusual—it’s a defining characteristic of global investing.
On average, the difference in return between the best- and worst-performing country
exceeded 43% over the past 10 calendar years. It’s no wonder investors may be tempted to chase recent winners or try to avoid losers. However, there’s little evidence that timing strategies consistently pay off. Country returns can turn quickly. For example, Canada posted the worst returns in 2015, down over 24%, but was the top performer in 2016, up over 24%. An investor who lost patience at the end of 2015 potentially missed out on the subsequent market recovery.
Country volatility is a normal part of global investing. Fortunately, as 2025 illustrates,
investors in a globally diversified portfolio can benefit from international diversification
without risking getting on the wrong side of country swings.
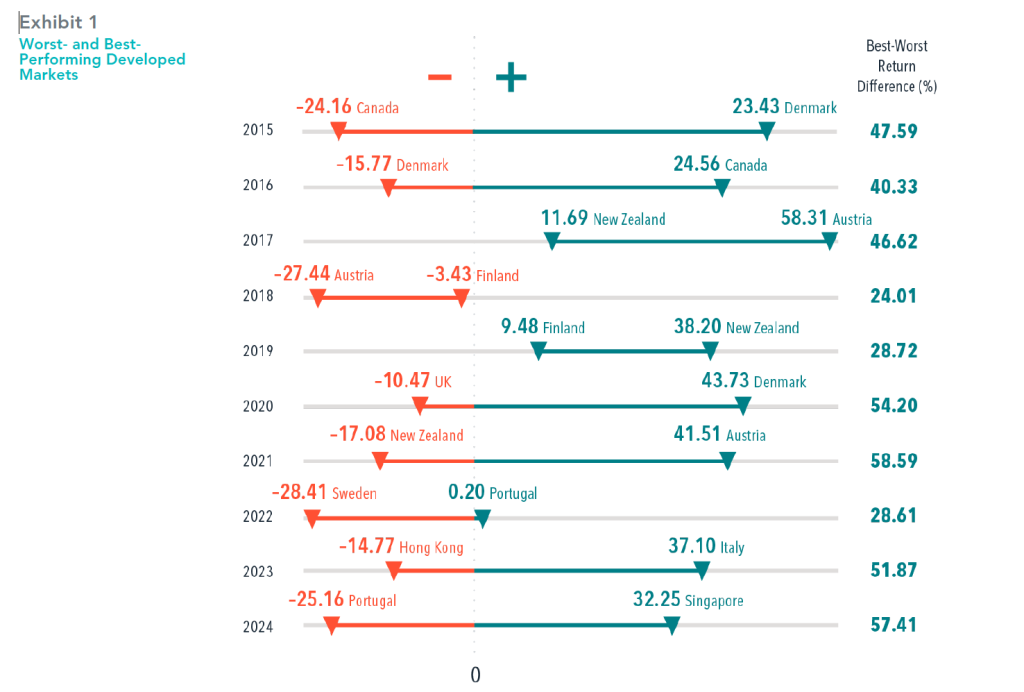
In USD. The US is included in the developed markets analysis. MSCI data © MSCI 2025, all rights reserved. Indices are not available for direct investment; therefore, their performance does not reflect the expenses associated with the management of an actual portfolio. Diversification neither assures a profit nor guarantees against a loss in a declining market.
Risks : Buying Investments can involve risk. The value of your Investments and the income from them can go down as well as up and is not guaranteed at anytime. You may not get back the full amount you invested. Information on past performance is not a reliable indicator for future performance. This information is intended for educational purposes and should not be considered a recommendation to buy or sell a particular security. The views expressed here are subject to change without notice and we can’t accept any liability for any loss arising directly or indirectly from any use of it.
To discuss your financial requirements or obtain other information click below
Share this article with your friends by clicking below
Chasing the returns of the biggest stocks in the US?
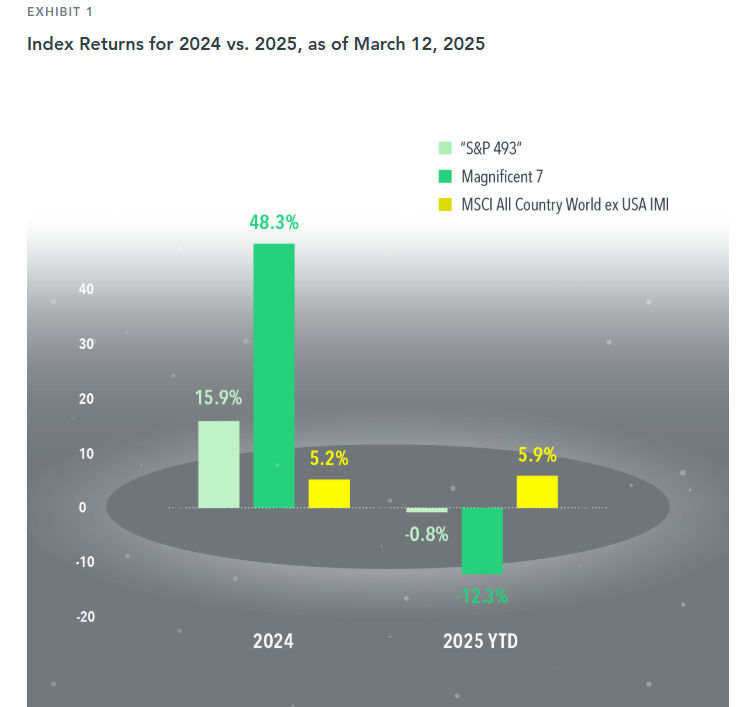
If top stocks exert a gravitational pull on the broad market’s return, the Magnificent 7 (Apple, Nvidia, Amazon, Tesla, Meta, Microsoft, Alphabet)have acted like the TON 618 black hole over the US the past few years.1 Accounting for about one-third of the S&P 500 Index’s weight2, the performance of these stocks has been a big driver of market-capitalization-weighted US large cap stock index returns.
This force can pull in a positive or negative direction. In 2024, the S&P 500 returned 25.0%. This was driven heavily by the Magnificent 7, which returned 48.3%. The other 493 stocks in the index collectively returned 15.9%. This year, the opposite effect has played out: The Magnificent 7 returned –12.3% through March 12, compared to –0.8% for the “S&P 493.”
The swings in performance for a US large cap index make a compelling case for global all cap diversification, which helps lessen exposure to the Magnificent 7. While non-US stocks underperformed the US in 2024, the MSCI All Country World ex USA IMI Index is outpacing the US thus far in 2025. Diversifying across regions and market capitalization is one way to mitigate the impact of a handful of stocks.
Risks : Buying Investments can involve risk. The value of your Investments and the income from them can go down as well as up and is not guaranteed at anytime. You may not get back the full amount you invested. Information on past performance is not a reliable indicator for future performance. This information is intended for educational purposes and should not be considered a recommendation to buy or sell a particular security. The views expressed here are subject to change without notice and we can’t accept any liability for any loss arising directly or indirectly from any use of it.
To discuss your financial requirements or obtain other information click below
Share this article with your friends by clicking below
MARKET INSIGHTS: STAYING THE COURSE
There is a lot of negative sentiment around at the moment and it seems hard to avoid! However, if a long-term investor is trying to understand short term valuations this graphic below may be of interest and provide reassurance.
Bear markets have occurred regularly over the last 70 years, without stopping the market’s permanent advance:
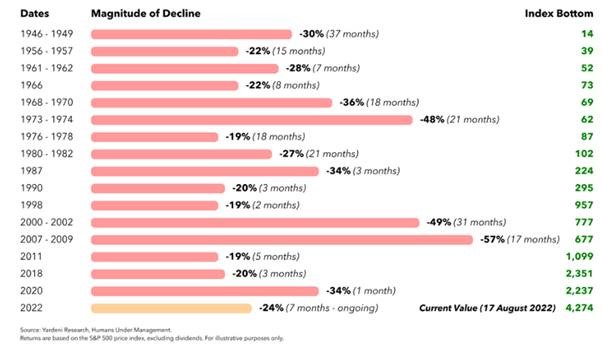
The above relates solely to the S&P 500 – although In practice owning a mix of assets and active management reduces risks and makes returns more steady.
On an emotional level investment sentiment is likely to swing wildly from optimism to pessimism and back again. Sideways with volatility!
We recognise that ultimately the key benchmark clients should care about is achieving their financial and life goals, and not running out of money. Monthly figures are a distraction from long term goals.
On an emotional level investment sentiment is likely to swing wildly from optimism to pessimism and back again. Sideways with volatility!
We recognise that ultimately the key benchmark clients should care about is achieving their financial and life goals, and not running out of money. Monthly figures are a distraction from long term goals.
Risks : Buying Investments can involve risk. The value of your Investments and the income from them can go down as well as up and is not guaranteed at anytime. You may not get back the full amount you invested. Information on past performance is not a reliable indicator for future performance. This information is intended for educational purposes and should not be considered a recommendation to buy or sell a particular security. The views expressed here are subject to change without notice and we can’t accept any liability for any loss arising directly or indirectly from any use of it.
To discuss your financial requirements or obtain other information click below