

Key steps to take before the tax year ends
With the 2025/26 tax year-end approaching, now is the time to act to maximise your financial opportunities. Key priorities include using your £20,000 ISA allowance for tax-efficient growth and contributing up to £60,000 (or more if carry forward is available and relevant earnings are sufficient) to your pension to take advantage of tax relief and long-term benefits. Other allowances, such as Capital Gains Tax, Dividend Allowance and Junior ISAs, are ‘use it or lose it’ opportunities. On page 08, we explain why early action avoids last-minute stress, secures tax savings and ensures financial growth.
With rising life expectancy, more of us will need long-term care, making early financial planning essential. Fees have surged, and regional cost disparities add to the challenge. Funding options include annuities, insurance, investments and equity release. On page 12, we consider how professional advice is crucial for navigating tax implications and securing a sustainable plan for future care needs.
Inheriting wealth can be life-changing but comes with challenges. On page 28, we explain why holding excessive cash may not be the best choice as inflation erodes its value. Instead, consider diversified investments to foster growth. Align your strategies with your goals, whether it’s retirement or supporting your family, and seek professional advice to maximise tax benefits and avoid pitfalls.
Financial uncertainty is growing, with many feeling life is unpredictable. Rising inflation, energy costs, and tax increases fuel concerns, prompting shifts such as increased cash savings and delayed retirements. While saving is important, balancing short-term needs with long-term investments is key. Reviewing pensions and seeking advice builds resilience and confidence. Turn to page 06.
A complete list of the articles featured in this issue appears opposite page and on page 03.
Wealth planning for your future

Risks : Buying Investments can involve risk. The value of your Investments and the income from them can go down as well as up and is not guaranteed at anytime. You may not get back the full amount you invested. Information on past performance is not a reliable indicator for future performance. This information is intended for educational purposes and should not be considered a recommendation to buy or sell a particular security. The views expressed here are subject to change without notice and we can’t accept any liability for any loss arising directly or indirectly from any use of it.
To discuss your financial requirements or obtain other information click below
Share this article with your friends by clicking below
US Market Not Partying Like It’s 1999
Much has been made of current US stock market valuations. As of November 30, the aggregate price-to-book ratio of the US market was 5.21—more than double the valuations of non-US developed and emerging market stocks. Many observers have drawn parallels to the late 1990s, when the gap between US and non-US valuations was similarly wide. Some view this as an omen for future returns—and not a good one given the US market’s infamous “lost decade” starting in 2000.
But this comparison may not be apples to apples. The weighted average profitability of the US market has surged in recent years, rising from 42% five years ago to 62% as of November 30. That’s a very different backdrop from 1999, when US market profitability declined over the subsequent five years.
Valuation ratios can be high because expected returns are low or because expected future earnings growth is high. There is no evidence that investors can reliably disentangle these effects in real time. But the strong profitability growth of recent years suggests a more nuanced story behind today’s US valuations. It is not clear that the US market requires poor future returns in order to “grow into” its current valuation levels.
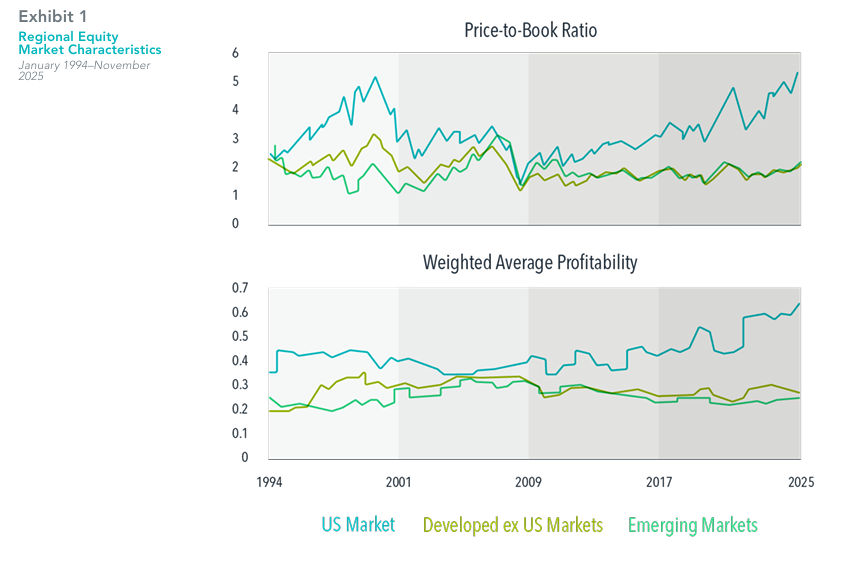
In USD. Source: CRSP and Compustat data calculated by Dimensional. Fama/French data provided by Fama/French. US Market is represented by the Fama/French Total US Market Research Index. Developed ex US Market is represented by the Fama/French International Market Research Index. Emerging Markets is represented by the Fama/French Emerging Markets Index. Monthly aggregate price-to-book ratios are computed as the inverse of the weighted average book-to-market value as of month-end. Firms with negative book value are excluded. Book-to-market ratios above 10 are winsorized as the cutoff value in non-US markets. Profitability is measured as operating income before depreciation and amortization minus interest expense scaled by book. Profitability values above 5 and below −2 are winsorized as the cutoff value. The Fama/French indices represent academic concepts that may be used in portfolio construction and are not available for direct investment or for use as a benchmark. Eugene Fama and Ken French are members of the Board of Directors of the general partner of, and provide consulting services to, Dimensional Fund Advisors LP.
Aggregate price-to-book ratio: The ratio of a firm’s market value to its book value, where market value is computed as price multiplied by shares outstanding, and book value is the value of stockholder equity as reported on a company’s balance sheet.
Profitability: A company’s operating income before depreciation and amortization minus interest expense scaled by book equity.
Risks : Buying Investments can involve risk. The value of your Investments and the income from them can go down as well as up and is not guaranteed at anytime. You may not get back the full amount you invested. Information on past performance is not a reliable indicator for future performance. This information is intended for educational purposes and should not be considered a recommendation to buy or sell a particular security. The views expressed here are subject to change without notice and we can’t accept any liability for any loss arising directly or indirectly from any use of it.
To discuss your financial requirements or obtain other information click below
Share this article with your friends by clicking below
Mind the Gap - Diversifying Across Countries
While many of us enjoy an international holiday this summer it might be timely to talk about countries!
Recently, there’s been a lot of noise around which country one should invest their savings in for the best growth, and the idea of allocating away from the US for many reasons. In the first half of 2025, developed markets outside the US returned 19.0%, outperforming the US and emerging markets. But that outcome masks the wide range of returns across individual countries, from Spain’s 43.0% to Denmark at −5.5%. This kind of dispersion isn’t unusual—it’s a defining characteristic of global investing.
On average, the difference in return between the best- and worst-performing country
exceeded 43% over the past 10 calendar years. It’s no wonder investors may be tempted to chase recent winners or try to avoid losers. However, there’s little evidence that timing strategies consistently pay off. Country returns can turn quickly. For example, Canada posted the worst returns in 2015, down over 24%, but was the top performer in 2016, up over 24%. An investor who lost patience at the end of 2015 potentially missed out on the subsequent market recovery.
Country volatility is a normal part of global investing. Fortunately, as 2025 illustrates,
investors in a globally diversified portfolio can benefit from international diversification
without risking getting on the wrong side of country swings.
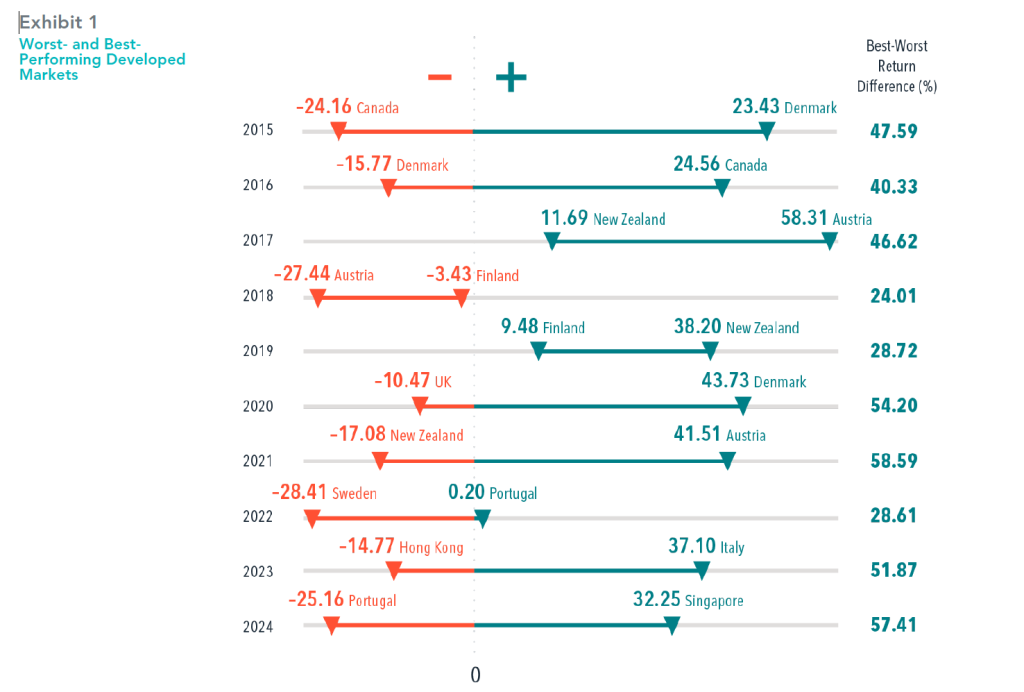
In USD. The US is included in the developed markets analysis. MSCI data © MSCI 2025, all rights reserved. Indices are not available for direct investment; therefore, their performance does not reflect the expenses associated with the management of an actual portfolio. Diversification neither assures a profit nor guarantees against a loss in a declining market.
Risks : Buying Investments can involve risk. The value of your Investments and the income from them can go down as well as up and is not guaranteed at anytime. You may not get back the full amount you invested. Information on past performance is not a reliable indicator for future performance. This information is intended for educational purposes and should not be considered a recommendation to buy or sell a particular security. The views expressed here are subject to change without notice and we can’t accept any liability for any loss arising directly or indirectly from any use of it.
To discuss your financial requirements or obtain other information click below
Share this article with your friends by clicking below
Market Insight: Sweeping changes
Welcome to our latest issue. The October 2024 Budget proposed sweeping changes to Inheritance Tax (IHT), significantly tightening the laws that were previously more forgiving for families with trading businesses and farmland. Effective from April 2026, these types of assets will now incur IHT at a reduced rate of 20% on valuations exceeding £1 million. On page 04, we consider why the changes are leaving many families scrambling to reassess their estate planning strategies.
Ten years ago, pension freedoms revolutionised how people access their retirement savings. These changes offered savers over 55 greater options to withdraw and manage their pension pots. However, a decade later, research indicates that many individuals are making critical financial decisions without seeking advice or fully understanding the tax implications. Read the full article on page 03.
A complete list of the articles featured in this issue appears on page 02.

Risks : Buying Investments can involve risk. The value of your Investments and the income from them can go down as well as up and is not guaranteed at anytime. You may not get back the full amount you invested. Information on past performance is not a reliable indicator for future performance. This information is intended for educational purposes and should not be considered a recommendation to buy or sell a particular security. The views expressed here are subject to change without notice and we can’t accept any liability for any loss arising directly or indirectly from any use of it.
To discuss your financial requirements or obtain other information click below
Share this article with your friends by clicking below
Chasing the returns of the biggest stocks in the US?
If top stocks exert a gravitational pull on the broad market’s return, the Magnificent 7 (Apple, Nvidia, Amazon, Tesla, Meta, Microsoft, Alphabet)have acted like the TON 618 black hole over the US the past few years.1 Accounting for about one-third of the S&P 500 Index’s weight2, the performance of these stocks has been a big driver of market-capitalization-weighted US large cap stock index returns.
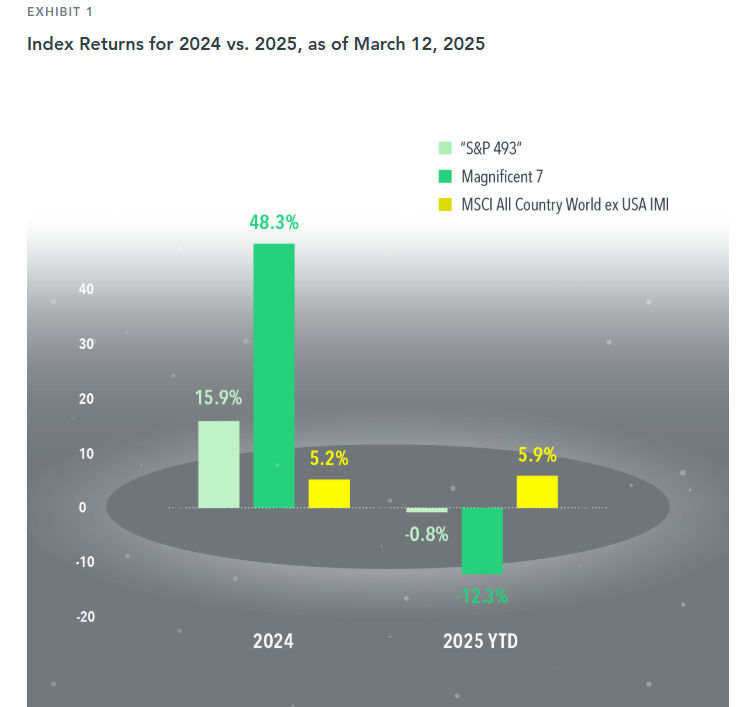
This force can pull in a positive or negative direction. In 2024, the S&P 500 returned 25.0%. This was driven heavily by the Magnificent 7, which returned 48.3%. The other 493 stocks in the index collectively returned 15.9%. This year, the opposite effect has played out: The Magnificent 7 returned –12.3% through March 12, compared to –0.8% for the “S&P 493.”
The swings in performance for a US large cap index make a compelling case for global all cap diversification, which helps lessen exposure to the Magnificent 7. While non-US stocks underperformed the US in 2024, the MSCI All Country World ex USA IMI Index is outpacing the US thus far in 2025. Diversifying across regions and market capitalization is one way to mitigate the impact of a handful of stocks.
Risks : Buying Investments can involve risk. The value of your Investments and the income from them can go down as well as up and is not guaranteed at anytime. You may not get back the full amount you invested. Information on past performance is not a reliable indicator for future performance. This information is intended for educational purposes and should not be considered a recommendation to buy or sell a particular security. The views expressed here are subject to change without notice and we can’t accept any liability for any loss arising directly or indirectly from any use of it.
To discuss your financial requirements or obtain other information click below
Share this article with your friends by clicking below